Practical · Building a Memory-Enabled AI Writing Partner (Part 4): Observability (Metrics + Logs + Trace + Cost)
In the previous post, we discussed the security of RAG systems and Prompt injection protection. Today, let’s dive into another engineering deep-water zone: Observability.
When a system evolves from “it works” to “it’s reliable long-term,” you will inevitably encounter three types of problems:
- Slow: Is retrieval slow? Is the LLM slow? Or is some Agent stuck in a retry loop?
- Expensive: Is a specific pipeline silently consuming all the tokens? Why doesn’t this month’s API bill add up?
- Weird: Intermittent bugs that can’t be reproduced, leaving you to fix code based on “gut feeling.”
At this stage, I chose to build a complete Metrics + Logs system, rather than just sprinkling in a few print statements.
1. Monitoring System Overview
The observability of this project consists of two parts, aiming to cover “macro-level health” and “micro-level traceability”:
- Metrics: Based on Prometheus, answers “Is the system generally healthy now? Where is the bottleneck?”
- Logs: Based on structured JSON + OTLP, answers “What exactly happened this time? What was the cause?”
Architecture Diagram
graph TD
    App[FantasyNovelAgent] -->|Push/Pull| Prom[Prometheus/Grafana Cloud]
    App -->|OTLP HTTP| Loki[Loki/Grafana Cloud Logs]
    App -->|File| LocalLog[data/logs/app.log]
    App -->|File| UsageStats[data/logs/usage_stats.json]
graph TD
App[FantasyNovelAgent] -->|Push/Pull| Prom[Prometheus/Grafana Cloud]
App -->|OTLP HTTP| Loki[Loki/Grafana Cloud Logs]
App -->|File| LocalLog[data/logs/app.log]
App -->|File| UsageStats[data/logs/usage_stats.json]graph TD
App[FantasyNovelAgent] -->|Push/Pull| Prom[Prometheus/Grafana Cloud]
App -->|OTLP HTTP| Loki[Loki/Grafana Cloud Logs]
App -->|File| LocalLog[data/logs/app.log]
App -->|File| UsageStats[data/logs/usage_stats.json]graph TD
App[FantasyNovelAgent] -->|Push/Pull| Prom[Prometheus/Grafana Cloud]
App -->|OTLP HTTP| Loki[Loki/Grafana Cloud Logs]
App -->|File| LocalLog[data/logs/app.log]
App -->|File| UsageStats[data/logs/usage_stats.json]2. Metrics: Answering the Most Critical Questions with the Fewest Dimensions
The system exposes metrics via the Prometheus Client (default port 9108) or pushes them via OTLP. I designed a set of custom metrics with the fna_* prefix, covering the most critical concerns of an AI system.
2.1 Core Metric Design
A. LLM Calls: Latency & Tokens
The core cost of an AI system lies in the LLM. We need to know the performance of each Agent, each model, and each Provider.
fna_llm_requests_total{agent,model,provider,status}: Call count.fna_llm_latency_seconds_bucket: Latency distribution.fna_llm_tokens_total{kind="prompt|completion|total"}: Token consumption.
Use Cases:
- Monitor API error rates (e.g., 429 rate limits, 5xx errors).
- Compare response speeds (Latency P95) across different models.
- Calculate real-time token consumption rate (Cost/Min).
B. RAG Retrieval: Hits & Risks
Retrieval is the lifeline of RAG.
fna_retrieval_requests_total{op,status}: Retrieval count (op=hybrid/vector/fts).fna_retrieval_latency_seconds_bucket: Retrieval latency.fna_rag_snippets_total{trust_tier,risk,action}: Retrieved snippet audit.
Use Cases:
- Monitor retrieval performance: If
search_hybridsuddenly slows down, the vector store might be having issues. - Monitor content safety: Observe the proportion of
action=droporaction=redactto detect potential injection attacks or low-quality retrieval sources.
C. Business Flows & Retries
User experience depends on “end-to-end” latency, not just a single function.
fna_flow_latency_seconds_bucket{flow}: Total latency for critical paths (e.g.,draft,brainstorm).fna_agent_call_retries_total: Agent retry count.fna_fact_guard_blocks_total: Fact conflict interception count.
Use Cases:
- Detect “invisible lag”: The user feels it’s slow, but the LLM is fast? The Agent might be stuck in a background retry loop.
2.2 Automatic Port Hunting
One of the most common “mysterious issues” during local development is port conflicts caused by Streamlit’s Hot Reload or multi-process models where old instances don’t exit properly: you think the new version is running, but you’re actually hitting the old process.
To reduce this debugging overhead, the system doesn’t stubbornly stick to a single port when starting the Metrics Server. Instead, it automatically tries ports within a range:
- Port Range: Starts from
9108, tries9108~9139, and selects the first available port. - Residue Handling: If a port is occupied, it automatically moves to the next one, preventing “zombie instances from completely blocking startup.”
- Debugging Advice: When you see multiple ports seemingly accessible, rely on the log entry
event=metrics_started—it records the final port bound by the current process, allowing you to quickly identify the “currently alive instance.”


3. Logs: Structured & Full-Stack Tracing
Logs are output as JSON Lines, written to data/logs/app.log, and can be reported via OTLP.
3.1 Why Not Use Print?
Traditional text logs (User clicked button) are difficult to analyze in AI systems. Structured Logging puts key information into JSON fields, making it easy to aggregate and query.
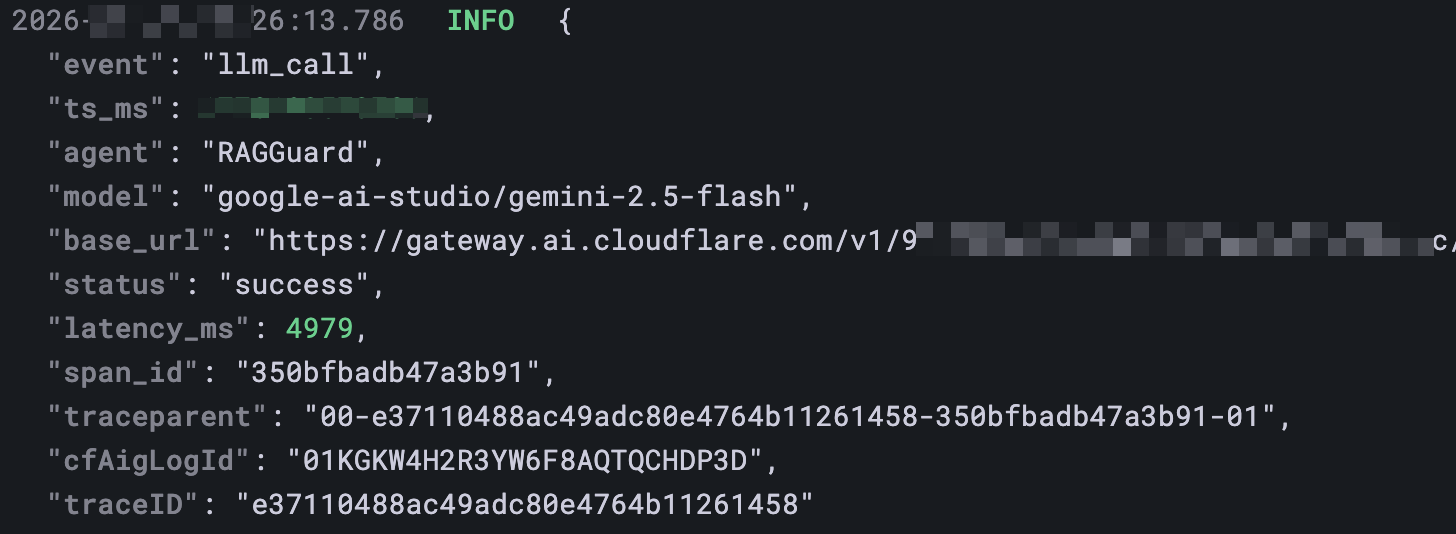
For example, an llm_call log entry:
3.2 Key Events (Event Schema)
I defined several key event types to connect the entire system’s behavior:
app_started/metrics_started: Lifecycle events.llm_call/llm_error: LLM interaction details (including TraceID, Latency, Tokens).rag_audit: RAG audit (Query, number of hit snippets, risk level).- Privacy Protection: When “sensitive mode” is enabled, the Query uses a “limited visibility” strategy: only the first 5 characters are kept for basic identification, while the original length and SHA-256 hash are recorded to prevent privacy leaks (see: Security: Privacy-Compliant Log Governance).
fact_guard_block: Fact consistency interception (what conflict was blocked).flow: Business flow completion (status, total duration).
3.3 Full-Stack Tracing (Trace Context)
Initially, I planned for a “single ID across the entire stack”: using the same trace_id to search local logs, OTLP, and the AI Gateway, tracing the path like a traditional microservice call chain.
However, I hit a practical constraint during implementation: after checking the Cloudflare AI Gateway documentation, I found that the gateway-side logs forcibly use their own cf-aig-log-id as the primary key. This means the application layer cannot change the gateway’s “primary ID” to our own trace_id.
Ultimately, I abandoned the idealistic “single ID” and implemented an explicit ID Bridge instead:
- Request Header Injection: Outgoing requests carry
traceparent(W3C Trace Context) andcf-aig-otel-trace-id, allowing the gateway’s OTEL/Loki logs to also carry a searchable correlation key. - Response Header Capture: Read the
cf-aig-log-idfrom the response headers and record it in the local structured log field (e.g.,llm_call.cfAigLogId), serving as a direct key to jump from the application to the gateway backend.
flowchart LR
  subgraph APP[FantasyNovelAgent (Application Side)]
    L[Local Structured Logs
llm_call / llm_error
trace_id + cfAigLogId]
  end

  subgraph GW[Cloudflare AI Gateway (Gateway Side)]
    W[Gateway Log Primary Key
cf-aig-log-id]
  end

  subgraph OBS[Grafana (OTLP / Loki)]
    G[Log Aggregation & Search
trace_id / cf-aig-otel-trace-id]
  end

  L -->|Request Header Injection
traceparent
cf-aig-otel-trace-id| W
  W -->|Response Header Return
cf-aig-log-id| L
  L -->|OTLP Report
trace_id| G
  W -->|OTEL Compatible
Carries cf-aig-otel-trace-id| G
flowchart LR
subgraph APP[FantasyNovelAgent (Application Side)]
L[Local Structured Logs
llm_call / llm_error
trace_id + cfAigLogId]
end
subgraph GW[Cloudflare AI Gateway (Gateway Side)]
W[Gateway Log Primary Key
cf-aig-log-id]
end
subgraph OBS[Grafana (OTLP / Loki)]
G[Log Aggregation & Search
trace_id / cf-aig-otel-trace-id]
end
L -->|Request Header Injection
traceparent
cf-aig-otel-trace-id| W
W -->|Response Header Return
cf-aig-log-id| L
L -->|OTLP Report
trace_id| G
W -->|OTEL Compatible
Carries cf-aig-otel-trace-id| Gflowchart LR
subgraph APP[FantasyNovelAgent (Application Side)]
L[Local Structured Logs
llm_call / llm_error
trace_id + cfAigLogId]
end
subgraph GW[Cloudflare AI Gateway (Gateway Side)]
W[Gateway Log Primary Key
cf-aig-log-id]
end
subgraph OBS[Grafana (OTLP / Loki)]
G[Log Aggregation & Search
trace_id / cf-aig-otel-trace-id]
end
L -->|Request Header Injection
traceparent
cf-aig-otel-trace-id| W
W -->|Response Header Return
cf-aig-log-id| L
L -->|OTLP Report
trace_id| G
W -->|OTEL Compatible
Carries cf-aig-otel-trace-id| Gflowchart LR
subgraph APP[FantasyNovelAgent (Application Side)]
L[Local Structured Logs
llm_call / llm_error
trace_id + cfAigLogId]
end
subgraph GW[Cloudflare AI Gateway (Gateway Side)]
W[Gateway Log Primary Key
cf-aig-log-id]
end
subgraph OBS[Grafana (OTLP / Loki)]
G[Log Aggregation & Search
trace_id / cf-aig-otel-trace-id]
end
L -->|Request Header Injection
traceparent
cf-aig-otel-trace-id| W
W -->|Response Header Return
cf-aig-log-id| L
L -->|OTLP Report
trace_id| G
W -->|OTEL Compatible
Carries cf-aig-otel-trace-id| GThe debugging process thus becomes a three-step flow:
- Check Local Logs: First, locate
llm_call/llm_errorto get thetrace_id(and the correspondingtraceparent). - Check Full Trace in Grafana: Use the same
trace_id(orcf-aig-otel-trace-id) in OTLP/Loki to aggregate related logs. - Check Details in Gateway: Copy the
cfAigLogIdrecorded in the local logs into the Cloudflare console search to review the request and response details observed by the gateway.

4. Cost Reconciliation: From “Local Ledger” to “Cloud Audit”
Beyond Metrics and Logs, there’s another very practical need: reconciliation. In practice, I experienced a cognitive evolution from “building my own local statistics” to “integrating a cloud gateway”: the former solves the last three miles on the engineering side, while the latter entrusts cost monitoring to specialized infrastructure.
4.1 Local Bookkeeping: Built for UI & Concurrent Environments
The project appends the token usage of each LLM call to data/logs/usage_stats.json.
Even with cloud monitoring in place, the local bookkeeping file remains indispensable, primarily solving two types of engineering problems:
- Concurrency Consistency (Atomic Writes): In Streamlit multi-process or Hot Reload scenarios, old processes often haven’t fully exited before new ones start writing. This uses a File Lock + Temporary File Atomic Replacement strategy to ensure the JSON ledger isn’t corrupted under extreme contention.
- UI Responsiveness: The “📊 Model Usage Statistics” panel on the Streamlit side needs to load in seconds. By aggregating this small JSON locally, authors can see in real-time, without calling external APIs: Which Agent is the “money pit”? Is the Context Pruning strategy working?
Example file structure:
4.2 Cloud Audit: Observability Reduction with Cloudflare AI Gateway
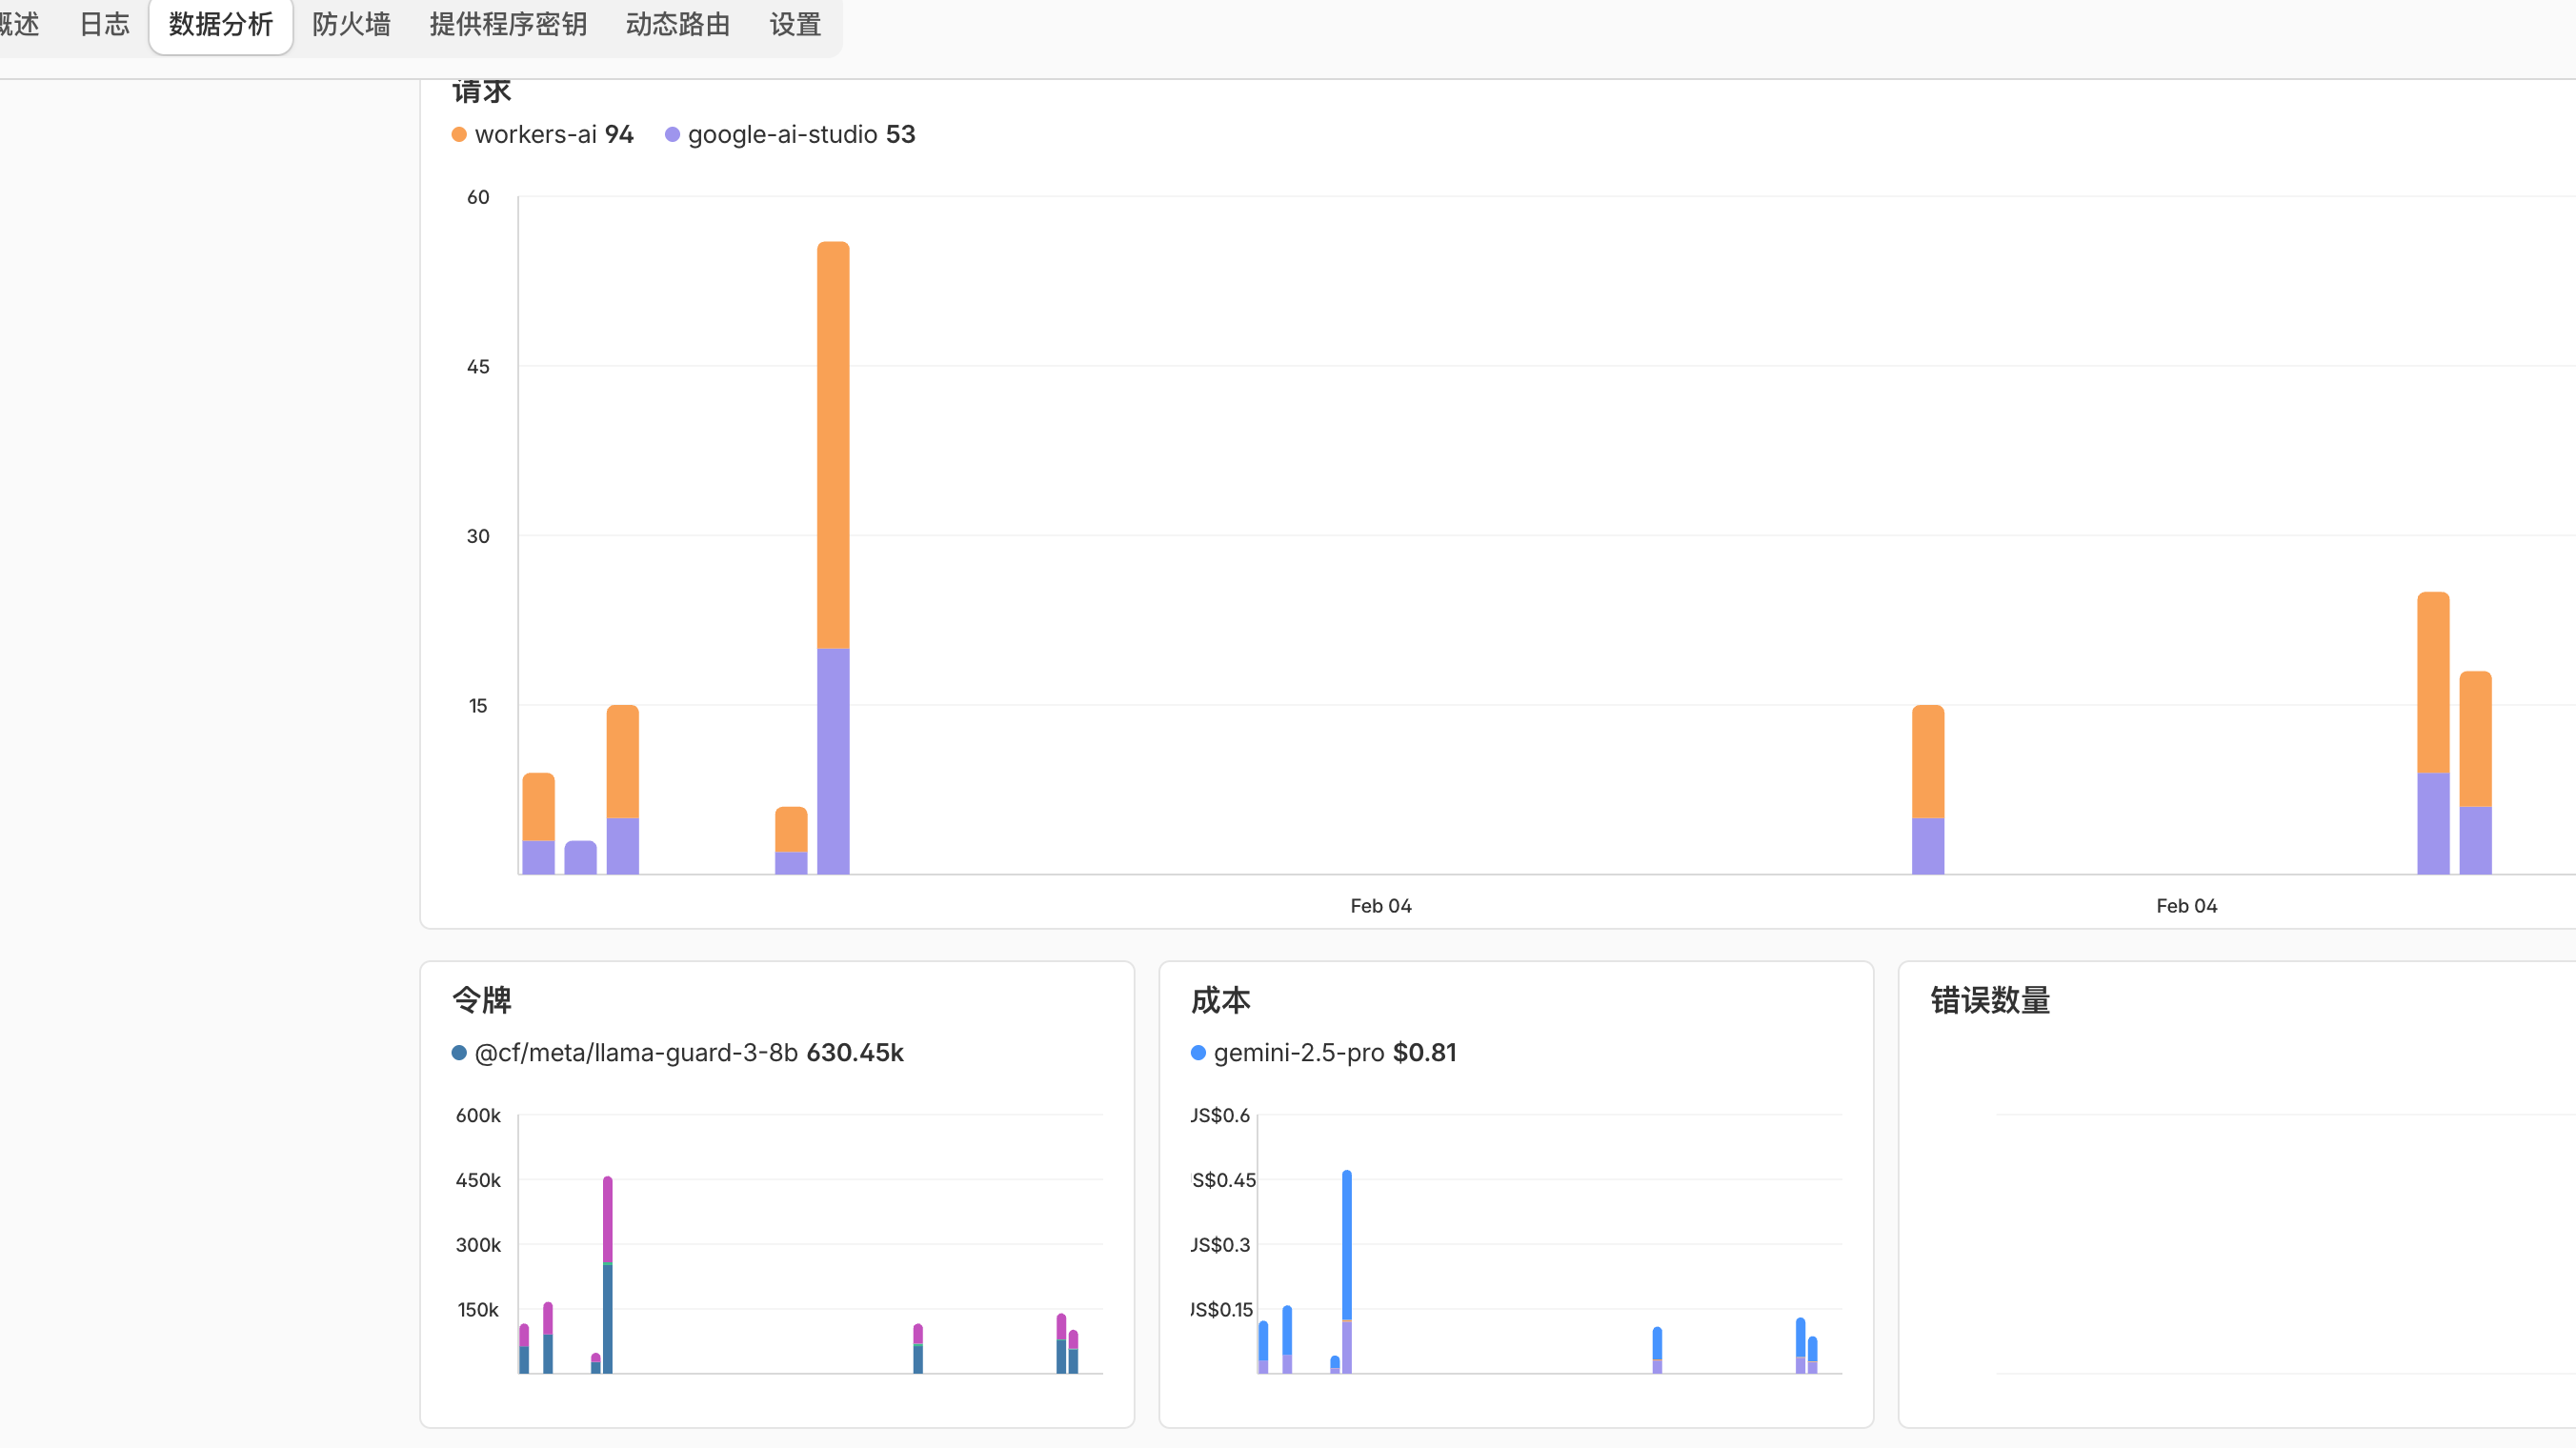
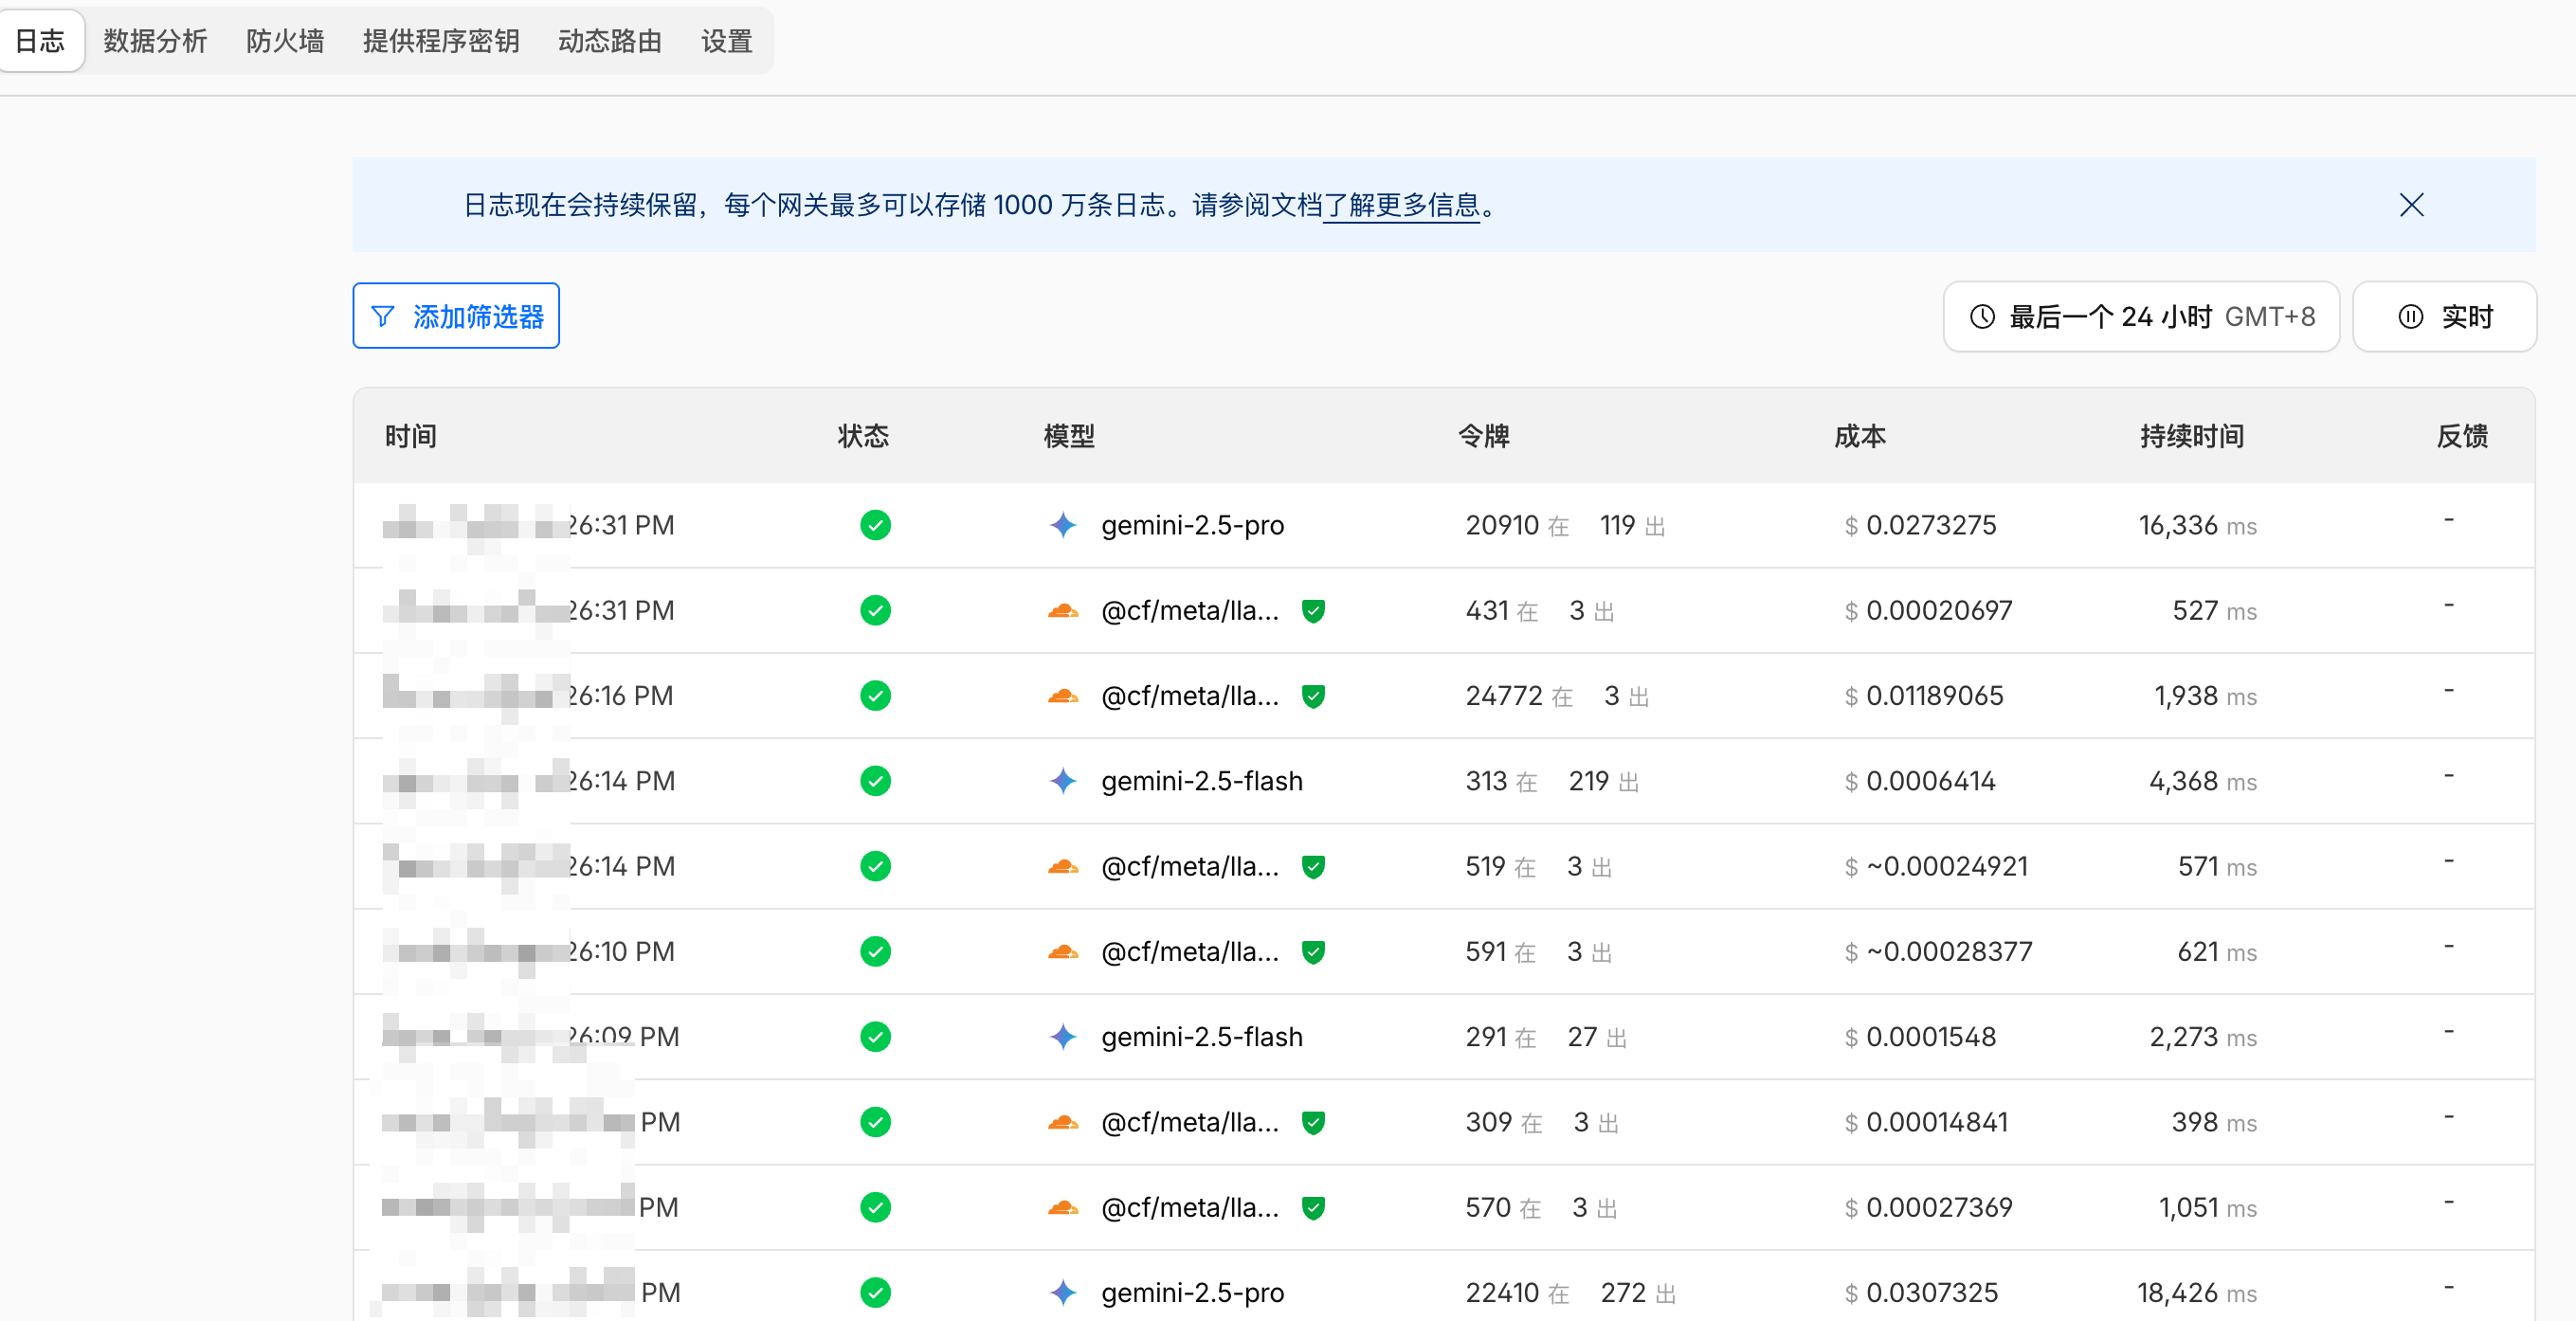
The real boost in “reconciliation efficiency” comes from infrastructure integration: once all LLM traffic passes through the Cloudflare AI Gateway, cost monitoring no longer relies on cobbled-together local scripts.
- Native Dashboard: Visualizations by model, time, rate, etc., are available out-of-the-box, saving the maintenance cost of “aggregating JSON + drawing custom charts.”
- Source of Truth Shift: The gateway sits at the network egress boundary, closer to the “real billing perspective.” When you need to align with the bill, cloud audit is often more stable and verifiable than in-application statistics.
- Local vs. Cloud Division: The local ledger handles development experience and concurrency reliability; the cloud audit handles global trends and bill verification. They are not redundant but cover different observability radii.


5. Privacy & Redaction
Privacy protection is crucial in observability. We don’t want users’ private novel content or Prompts appearing on a Grafana dashboard.
Local vs. External Distribution Strategy
This “more detailed locally, more restrained externally” strategy is also fully detailed in the previous security post (RAG audit sensitive mode, external reporting whitelist and redaction), which can be read in conjunction: Building a Memory-Enabled AI Writing Partner (Part 3): Security Architecture (RAG Protection, Fact Guard & BYOK).
Local Logs (
data/logs/app.log):- Retains more detail by default for local debugging.
- Supports enabling RAG Audit Sensitive Mode: The Query is not saved in full; only the first 5 characters are kept, along with the original length and SHA-256 hash.
External Logs (OTLP/Loki):
- Granular Redaction by Event: Supports enabling “external log redaction,” controlled by a “master switch + event whitelist (
enabled_events).” By default, it only applies torag_auditandllm_call; other events are not redacted to preserve debugging capability. - Whitelist Mechanism: Only allows specific events (e.g.,
llm_call,rag_audit) to be reported; other debug logs are intercepted locally.
- Granular Redaction by Event: Supports enabling “external log redaction,” controlled by a “master switch + event whitelist (
6. Closing the Loop: Observability-Driven Architecture Optimization (Context Pruning)
The value of observability isn’t just “seeing the problem”; it’s about turning optimization into a verifiable engineering loop.
A classic example is “Context Pruning”: using structured cards like world_cards / future_plan_cards to extract reusable information from the prompt body, reducing prompt_tokens, thereby lowering costs and improving stability.
How to quantitatively verify that this “actually saves money”:
- Check Metrics: Observe the trend of
fna_llm_tokens_total{kind="prompt"}(comparing the same task, model, and Agent before and after). - Check the Cost Reconciliation File: Compare the
prompt_tokens/total_tokensdistribution for the sameprofile_idindata/logs/usage_stats.json. This directly reflects the effectiveness of the strategy.
When you can use metrics and reconciliation data to prove that “the structured card strategy indeed reduced prompt_tokens,” you’ve upgraded from “empirical parameter tuning” to “data-driven architecture design.”
7. Conclusion: From Black Box to White Box
Building AI applications, especially complex Agent systems, often feels like alchemy—throw in a bunch of Prompts and wait for a result.
By introducing Metrics and Structured Logs, we aim to turn this “black box” into a “white box”:
- See Latency: Know whether the vector store or the model is the bottleneck.
- See Costs: Know exactly which Agent is spending every penny.
- See Risks: Know how many potential injection attacks the system has intercepted.
Only by “seeing” can you optimize. This is the solid foundation for engineering implementation.
References
🤖 AI Related Posts by semantic similarity
Want updates? Subscribe via RSS
Related Content
- From Azure SRE Agent to HolmesGPT: AIOps Practices in Multi-Cloud Kubernetes Environments
- Practical · Building a Memory-Enabled AI Writing Partner (Part 3): Security Architecture (RAG Protection, Fact Guard, and BYOK)
- Practical Guide: Building a Memory-Enabled AI Writing Partner (ikun) – Retrieval System (Vector Search, Hybrid Search & Cloud Deployment)
- Practical · Building a Memory-Enabled AI Writing Partner (Part 2): Database (From JSON to Single Table to Relational Tables)
- Practical Guide · Building a Memory-Powered AI Writing Partner (Part 1): Multi-Agent Architecture Evolution